|
Aleph Zero Home |
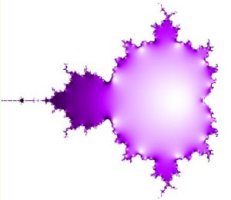
Most pictures of the Mandelbrot set show the set in black. The interesting patterns occur in the points just outside the set. However, here I have provided interactive graphical tools for exploring the structure of the inside of the set.
To determine whether a point is in the Mandelbrot set, a rule is applied to get a second point. Then the same rule is applied to the second point to get a third, and so on. This sequence of points I will call an orbit. At each step in the calculation the same rule is applied to the point found in the previous step. If the points in the orbit stay near the origin, zero, then the first point is in the Mandelbrot set. But if the points wander off into the distance, then the first point is not in the set.
 The origin is marked by marked as white cross hairs in this picture.
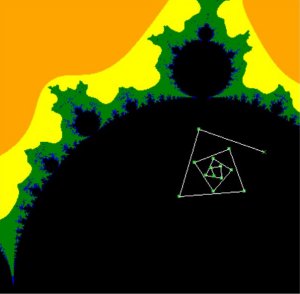 In this picture I show the first few points in an orbit. The points are joined by white lines so
that you can see the order in which they were produced. Here the points spiral in ever
smaller triangles, and so the first point is in the set.
In this picture I show the first few points in an orbit. The points are joined by white lines so
that you can see the order in which they were produced. Here the points spiral in ever
smaller triangles, and so the first point is in the set.
 Here is the orbit of a point that is not in the set. I have drawn a red
circle on the picture. As soon as we find a point in the orbit that is outside this circle,
we know that the first point is not in the set. The circle has radius 2, and is centered at
the origin.
Here is the orbit of a point that is not in the set. I have drawn a red
circle on the picture. As soon as we find a point in the orbit that is outside this circle,
we know that the first point is not in the set. The circle has radius 2, and is centered at
the origin.
In the pictures above, the points just outside the set are coloured according to how many points
there are in the orbit before a point outside the radius 2 circle is found.
I have used only seven colours as follows:
| Colour | Number of steps needed to get outside the radius 2 circle |
|---|---|
| White | 0, the first point is outside |
| Pink | 1 step, the second point is outside |
| Orange | Less than 6 steps |
| Yellow | 6 to 10 steps |
| Green | 11 to 50 steps |
| Blue | 51 to 100 steps |
| Purple | More than 100 |
At step 0, each point is coloured according to its distance from the origin, giving circles.
For other step numbers, the distance from the origin of the corresponding step in the orbit is used.
Settings
Enter the step number. Choose Rainbow colours, or a single colour.
You can change the single colour by tapping on the colour box.
Then press the Plot button to see the result.

Settings
| Plot button | Draws the picture. |
| Reset button | Resets the center and zoom values and the maximum period. |
| Input maximum period | There will be less differentiation between the colours for higher values of the maximum period. |
| Input X and Y | A point can be selected by tapping on the picture or by entering its X and Y coordinates in the boxes. |
| Center on (X,Y) button | Sets the center of the picture. Useful when zooming in to see more detail. |
| Input Length of Orbit | The number of steps to calculate when superimposing an orbit on the picture. |
| Draw Orbit for (X,Y) button | Draw the orbit starting at point (X,Y) for specified number of steps. |
| Zoom In button | Magnifies part of the picture keeping the center fixed. |
| Zoom Out button | Keeps the center fixed as the contents of the picture shrink. |

|
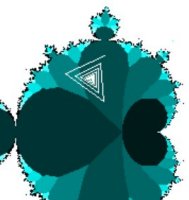
This picture shows the orbit of the point X=-0.64, Y=0.4185. I have ignored the first
1000 steps in the orbit, and then plotted the next 100 steps. As you can see, the
orbit is just jumping between seven points. These 7 points are the limit set for the point (X,Y), so the limit set period of this point is seven. |
Settings
| Plot button | Draws the picture. |
| Reset button | Resets the center and zoom values, the maximum period and the colour. |
| Input maximum period | There will be less differentiation between the colours for higher values of the maximum period. |
| Input X and Y | A point can be selected by tapping on the picture, or by entering the X and Y coordinates in the boxes. |
| Center on (X,Y) button | Sets the center of the picture. Useful when zooming in to see more detail. |
| Zoom In button | Magnifies the picture keeping the center fixed. |
| Zoom Out button | Keeps the center fixed as the contents of the picture shrink. |
| Input number of steps | The number of steps to draw when showing the limit set. |
| Draw Limit for (X,Y) button | Draw the last few steps of the orbit, to show the limit set. |
Advanced settings
Epsilon : how close two points must be for them to be treated as the limit.
Maximum iterations : More iterations means a more accurate picture but the calculations
will take longer.

In this picture the maximum iterations has been set to 100. As you can see, parts of the main
body of the Mandelbrot set, have been coloured green and blue, indicating limit periods of
2, 3, 4 and 5. But we know the limit period should be 1. We have not calculated sufficient steps for the
points to be closer than epsilon to each other.